

Hire Expert Chart.js Developers

Role
chart.js developers
Transform your data visualization capabilities with Logamic's top-tier Chart.js talent. Our skilled developers create stunning, interactive charts and graphs that bring your data to life, delivering responsive visualizations that work seamlessly across devices while maintaining optimal performance and user experience.
Role
chart.js developers
Rated 5/5 stars based on 100+ reviews

Rated 4.9/5 stars based on 11 reviews

Our chart.js engineers

Daniela
Chart.js developer
Previously at


Lilla
Chart.js developer
Previously at


Jozef
Chart.js developer
Previously at


Ivan
Chart.js developer
Previously at


Adrian
Chart.js developer
Previously at


Štefan
Chart.js developer
Previously at

Bogdan
Chart.js developer
Previously at


Radoslav
Chart.js developer
Previously at

Are you looking for someone else?


In the past years of cooperation, Logamic was able to help us with sourcing high demand profiles such as Front end, full-stack developer and DevOps Engineer in a nearly instant manner. Logamic was not only able to provide experienced skilled candidates, but carefully selected personalities fitting culturally to the team.

Ľubomír Karlík
Head of AI Transformation, Raiffeisen, Raiffesen Bank

I always appreciated the technical background of Logamic staff because they understood our needs and provided suitable CVs to us in 1 to 3 days. We contracted for our AI and deep learning product QA automated testers, DevOps, Java and Python engineers over the last years of our cooperation.

Francisco De Sousa Webber
CEO, Cortical

Staffing has never been so easy as since using Logamic for our recruitment needs. With the help of their AI bot, they are always able to provide candidate CVs tailored to our requirements and quicker than others. We have hired app. 25 React, C# .NET, Android and iOS developers, QA testers and DevOps engineers over the last years of co-operation.

Nikola Anusev
Director, Telus

Logamic found the right Software developers to do the digital transformation from on-premise into the cloud. I am satisfied with our long-term cooperation because we can progress rapidly.

John-Paul Pazhedath
Head of Digital Workplace, Wienerberger

Logamic guys are leaders in Microsoft technologies and thanks to their passion for Xamarin and .NET it is a pleasure to cooperate with them.

Milan Hrabovský
DX lead, Microsoft

Logamic is since many years a reliable partner in establishing contact with high-grade candidates. We very much appreciate the partnership with logamic, since they truly provide an excellent service – with realistic pricing included!

Thomas Brustbauer
Managing Director, Uniqua
Discover our success stories
At Logamic, we offer JavaScript development expertise that drives innovation and business growth.

April 12, 2026
The CTO’s Guide to IT Sourcing Models
A practical guide for CTOs comparing In-House Hiring, Agencies, and IT Staff Augmentation to help engineering leaders choose the best model for scaling their tech teams efficiently.

April 12, 2026
Speed-to-Deploy: Hire IT Talent in 72 Hours
Discover how deploying senior engineers within 72 hours eliminates recruitment lag, protects sprint velocity, and gives tech leaders a decisive competitive advantage.
April 12, 2026
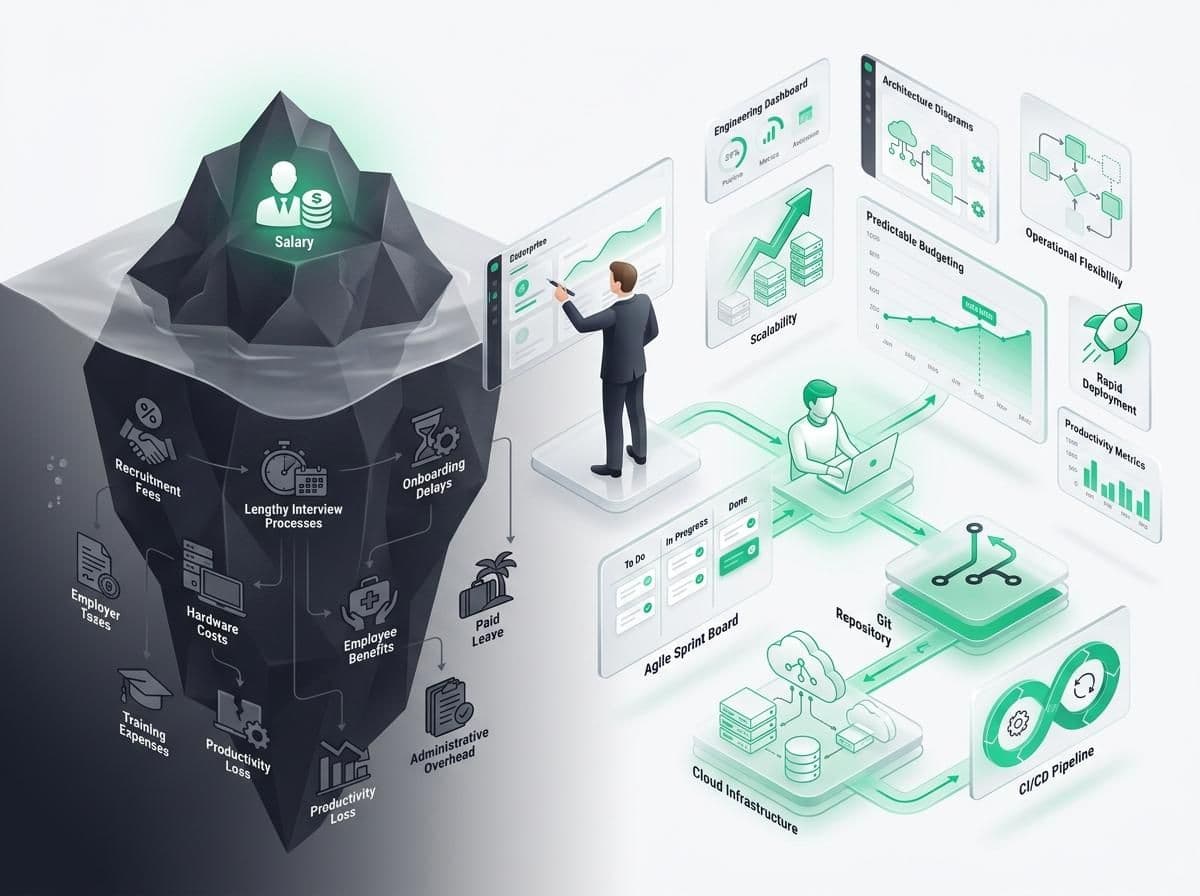
Why Traditional IT Recruitment Is More Expensive Than It Looks
An eye-opening financial breakdown showing CEOs and CFOs why traditional IT recruitment costs far more than base salaries and how staff augmentation eliminates hidden hiring overhead.
Our Hiring Process
A simple, transparent process to help you build your JavaScript development team quickly and efficiently.
Benefits of Hiring Our chart.js Developers
Partner with Logamic to access top chart.js talent and accelerate your development projects.


200 000+ SW engineers
Big database covers your needs.

Fast delivery
Onboard the suitable person in 3 days.

The highest quality
14 years of experience in custom SW development and IT recruiting.

No money ahead
Single payment for all externals after each month.

Perfect match
As ex-developers, we easily understand your technical needs.
Frequently Asked Questions
Get answers to common questions about hiring chart.js developers through Logamic.
How quickly can I hire chart.js developers through Logamic?
Most of our clients are able to hire and onboard chart.js developers within days depending on their internal processes. After you share your requirements, we typically present pre-vetted candidate CVs within 24-48 hours, and you can interview them immediately.
What is the minimum contract period for hiring chart.js developers?
We offer flexible contract options, but our minimum contract period is typically 3 months. This allows both you and the developer to ensure a good fit and successful collaboration.
How do you ensure the quality of your chart.js developers?
All our chart.js developers go through a rigorous vetting process that includes technical assessments, coding challenges, and interviews to ensure they have the skills and experience needed to meet your project requirements. If you prefer to arrange your own coding session, feel free to let us know.
Can I hire full-stack chart.js developers?
Yes, we have a database of full-stack chart.js developers who are proficient in both frontend and backend technologies. You can specify your requirements, and we will match you with candidates that fit your needs.
What if I'm not satisfied with the hired developer?
If you are not satisfied with the hired developer, we work hard to find a replacement at the shortest possible time.
How to Hire Chart.js Developers
A comprehensive guide to finding and engaging skilled Chart.js developers for your data visualization initiatives.
Understanding the Chart.js Ecosystem
Chart.js represents one of the most popular open-source JavaScript charting libraries, providing a simple yet flexible solution for creating responsive, animated charts using HTML5 Canvas. Known for its ease of use, lightweight footprint, and extensive customization options, Chart.js has become the go-to choice for developers seeking to implement professional data visualizations without the complexity of more comprehensive libraries like D3.js. The Chart.js ecosystem encompasses a core library that supports eight chart types out of the box: line, bar, radar, doughnut, pie, polar area, bubble, and scatter charts. This foundation is extended by a plugin architecture that enables additional functionality through both official and community-developed plugins. The ecosystem includes adapters for different date libraries, animation frameworks, and integration patterns with popular frontend frameworks like React, Vue, and Angular. Beyond the technical components, the Chart.js methodology emphasizes simplicity without sacrificing capability. The library provides sensible defaults that work well for most use cases while offering extensive configuration options for customization. It supports responsive design principles, ensuring charts adapt to different screen sizes automatically. The framework handles cross-browser compatibility issues and provides graceful degradation for older browsers, making it suitable for enterprise applications with diverse user bases. The Chart.js approach offers significant advantages including minimal learning curve for basic implementations, excellent performance through Canvas rendering, built-in animation and interaction capabilities, comprehensive documentation and community support, and seamless integration with modern JavaScript frameworks. These benefits have made Chart.js a preferred choice for dashboards, analytics applications, monitoring systems, and business intelligence tools across industries. Understanding this ecosystem is essential when identifying the right Chart.js developers for your organization. Beyond basic chart implementation, effective Chart.js professionals must grasp canvas rendering concepts, understand performance optimization techniques, appreciate accessibility considerations, and know how to extend the library for custom requirements rather than forcing complex visualizations into standard chart types.

Ready to boost your development capabilities?

Connect with our expert chart.js developers and accelerate your project timeline.